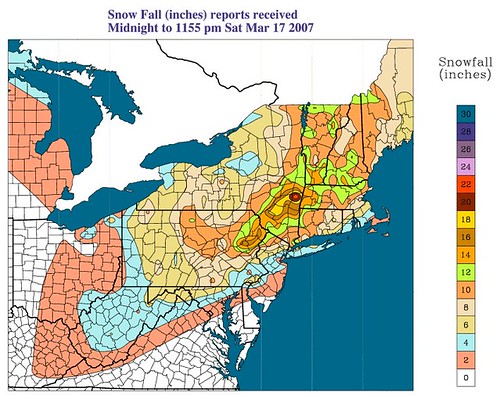
Final Snow/Sleet Totals across the Northeast, as reported to PSU's Public and Spotter Page.
This storm report is based on a procedure we've established on the site since since 2005. The actual amount is graded by it's % deviation from the forecast, and then grades on a GPA scale. Now in fairness...we have not yet reached consensus on the discussion board here if the grade should be actual accumulation of just SNOW or can it be SNOW & SLEET or just SLEET. Obviously the 2 recent storms have retrained everyone as to what sleet is and can do to a forecast.
Also in fairness…please note I don’t just pick and choose among the best actual observations. Frequent long term readers know and can vouch for the fact that when I say “NYC / Boston / PHL ” I have used the same locations each storm… NYC = Central Park / Boston = Logan airport / PHL = airport. The other locations are from members of the discussion community based on their obs posted in the comments.
Just for a new reader to know there’s no sugar coating here. The numbers speak for themselves, good, bad or ugly.
The numbers are: Final GPA / City forecasted / amount forecasted / actual / %dev / grade
The GPA is determined by the standard 4.0 academic scale:
4.0 A / 3.67 A- / 3.33 B+ / 3.0 B / 2.67 B- / 2.33 C+ / 2.0 C / 1.0 D / 0.0 E
0.00 / Baltimore (BWI): 2.0 / .6?/ 70%/ 30% = E
3.33 / Dundalk, MD: .75 / .85 / 12% / 88%=B+
0.00 / Philly (PHL): 6.0 / 3.0 /50% / 50%=E
2.33 / New York (Central Park): 7.0 / 5.5 / 21% / 79%=C+
4.00 / Boston (Logan): 8.0 / 8.1 / 2% / 98%=A
0.00 / Greencastle, PA: 9.0 / 5.0 / 45% / 55%=E
2.00 / Martinsburg, WV: 10.0 / 7.0 / 30% / 70%=C
2.00 / Paoli, PA: 7.0 / 5.0 / 29% / 71% = C
0.00 / Bucks Co, PA (Doylestown, PA) : 11.0 / 5.7 / 49% / 51%=E
1.00 / Central NJ (New Brunswick): 6.0 / 4.0 / 34% / 66% = D
0.00 / Fallston, MD: 4.0 / 1.0? / 75% / 25%=miserable E--- sorry Terpguy
So despite your claims that “this guy is always right!” you can plainly see that is not true!
Storm Forecast GPA = Less than thrilling 1.33 / (some would say, it’s at least passing! But far less than the C average of the February 11-12, 2006 Storm or the January 2005 Blizzard.
So your 2 week forecast should have been something like this:
THIS WEEK: 80's then much colder with rain changing to snow and sleet.
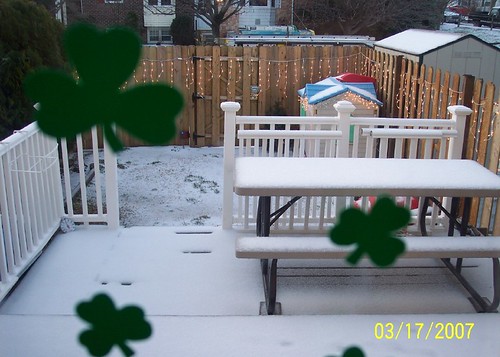
Ice-encrusted backyard of "Fort Jackson" as we call it (named after our street)
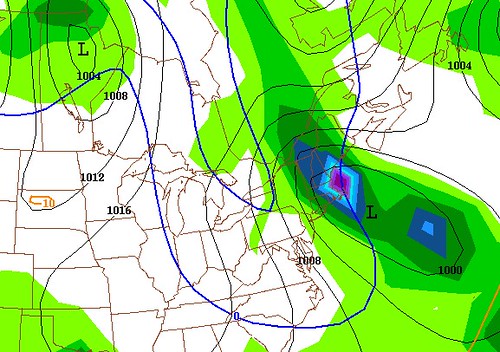
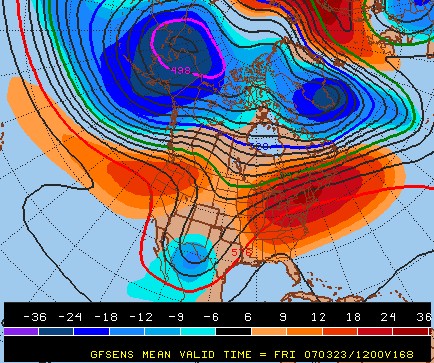
Seems like I've posted this same map before, a couple times this winter.
NEXT WEEK: Chilly and a bit cloudy until mid-week, then sunny and becoming warmer by late in the workweek. Mid 70's by Saturday from southern PA south to Richmond, near 70 Philly to NYC, 60's from NYC north to Boston.
( I knocked out my claim to 90 because the clipper coming across Great Lakes Sun-Mon will reintroduce second High I theorized early last week, holding mid-week temps down a bit)
WEEK AFTER: Turning colder with snow possible by Palm Sunday Weekend?!?!?