
Word is getting around.
SIGNIFICANT TO HIGH IMPACT COASTAL STORM BECOMING MORE
PROBABLE FOR FRIDAY INTO SUNDAY ACROSS THE MID-ATLANTIC
PROBABLE FOR FRIDAY INTO SUNDAY ACROSS THE MID-ATLANTIC
LAST TIME OUR TEAM SAW WHAT IS ON CURRENT COMPUTER
MODELS WAS ABOUT ... 6 YEARS AGO. YOU DO THE MATH.
MODELS WAS ABOUT ... 6 YEARS AGO. YOU DO THE MATH.
6:30 PM EST 1/18 - Preliminary Scenario Map for Friday 1/22 into Saturday 1/23.

11:00 AM EST 1/18 - There's no denying what weather watchers suspect has been going on behind the scenes of those in the forecasting community. For several days now, a number of computer models ranging from the often-hailed European, to the newly enhanced U.S. Global Forecast System to the Canadian, are showing similar projections for a potentially large scale coastal event this weekend. That much is true.
 |
| Atmospheric analyzers know this is the 500 mb heights map and understand how significant it is to depict what looks like a "cutoff Low" parked just off the coast. |
THREAT ASSESSMENT: Below is a Winter Storm Threat Graphic from the Sterling VA National Weather Service for the region shown. Current assessment places a Moderate probability of a significant, disruptive storm. For a national look at winter storm probability, view the NOAA Weather Prediction Center's Day 4-7 Assessment.

WHAT WE CAN TALK ABOUT: LARGE SCALE FACTORS
Without these indicators all pointing in a favorable direction (if you want snow), storm potential is lost quickly. Here's a quick rundown of a few items on our Indicator checklist:
- EL NINO: It's very active, has recently peaked and the after effects continue to enhance every Tom, Larry and Moe of a storm that has come along this season. Remember the Carolina and Mississippi floods? Imagine if that was snow.
- NORTHERN SNOW COVER: Rebounding lately thanks to Arctic air and frequent clippers / fronts piling up Lake Effect snow in critical spots.
- ATMOSPHERIC INDICATORS: Without these gate keepers, you have no storm. The three big ones we follow are lining up nicely as is expected right before a Big Kahuna: The PNA is going positive (a western ridge), the North Atlantic Oscillation is staying negative but rising slowly, as is the Arctic Oscillation (AO). Those two in tandem bring us a nice deep Eastern trough. The result is the map you see below.
- SURFACE INDICATORS: The Day 6 map from the NOAA Weather Prediction Center is probably most revealing about what fortunes are ahead in white & wintry nights.

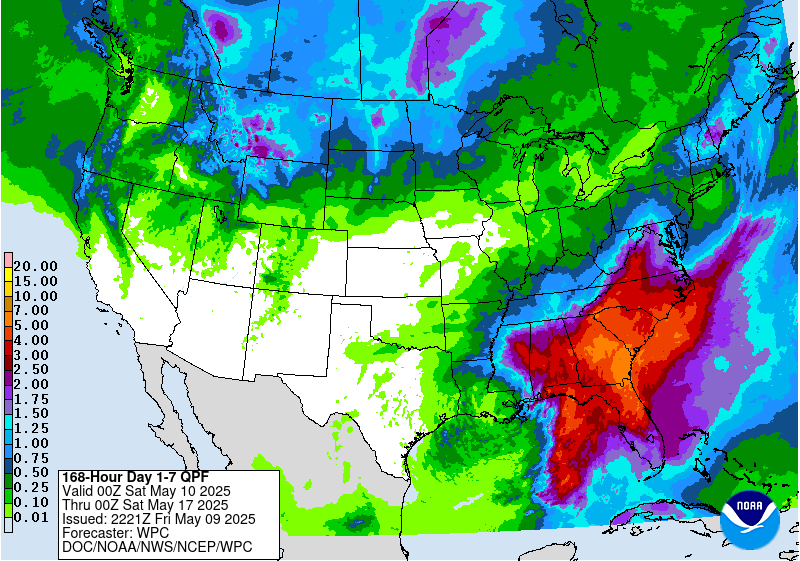
Latest liquid Day 5-7 liquid projections from the NOAA WPC:
That is 1.5" to 2.0" for the major metro areas. Hint: It's not going to be falling as a liquid.
WHAT IT MEANS FOR YOU:
- If you were not around in the Mid-Atlantic for the 2010 storms, it would be a good idea to talk with someone who was. We're sure they can provide some insight on what you'll need to do.
- If you were around this area in 2010, it's not unreasonable to consider what you would differently if you had to face that again. It's not panic, it's prudent preparation. Unless you want to wait in line later this week. Besides, you'll eat the food regardless of what happens..
- But, if don't want to wade through social media for the next update to find out what we really think, it's time to join the Insiders. We'll see you over there.
-The FF Winter Stormcast Team